| This article originally appeared in Geospatial Solutions Magazine's Net Results column of May 1, 2003. Other Net Results articles about the role of emerging technologies in the exchange of spatial information are also online. | |
| 1. Introduction and Glossary 2. Data Flow 3. Indexing Challenge 4. Instant Messaging Conundrum | |
| Data Flow Information flows through real-time data systems in three possible directions: to the mobile device owner, to someone else (Big Brother!) monitoring the mobile device owner, or between two or more participants in a data exchange. For instance, a mobile device owner could identify the least-congested roads within a mile of his or her current location. Or, parents could receive notification when their commuting child has arrived safely at school. Most technically challenging, though, is the mobile-to-mobile information exchange, such as when a taxicab driver calls a special number and is automatically connected to the nearest strolling pedestrian who needs a ride. Or, consider a law-enforcement scenario (see Figure 2). Parolee #432’s car and Protected Witness #567’s PDA are now within 50 meters of each other -- send an SMS warning to the bodyguard’s cell phone! |
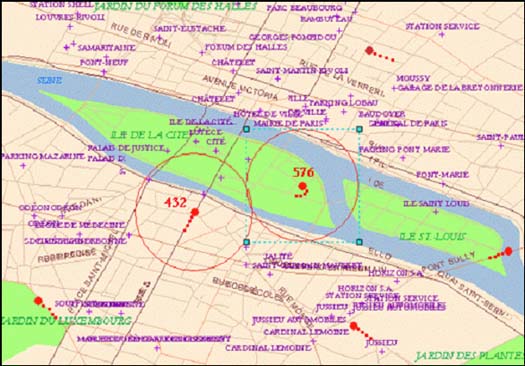 Figure 1: Two real-time events of several tracked vehicles in central Paris set off an alarm (a database trigger) when they become closer than 50 meters to each other. Paris basemap courtesy of TeleAtlas. |
|
In the first two of these information flows, a solitary database system can process the
input from 100 mobile units at acceptable speeds, even when their coordinates are entered
into the system as rapidly as every 5 seconds. Real-time data processing systems for small
collections of events, such as a fleet of 100 trucks, do not have to be complicated or
outrageously expensive. A company called Locarta (www.locarta.com), for instance, sells $700
dashboard units approximately the size of cigar boxes that are each their own wireless Web
site. Visiting the site returns the unit’s real-time GPS coordinates. Add a spatial database,
a connection to mapping software, and the only remaining expense is the application
development. Reality bites. This same system, however, will crawl or break if the collection of events is large, such as 100,000 simultaneously moving units. Likewise, even with just 100 moving units, performance of a mobile-tomobile query may be unacceptably slow. Because telecommunications firms are likely to offer real-time services to customer bases of 1 million or more people, a solution to the problems raised by large, mobile-tomobile, real-time datasets is an important goal. Furthermore, spatio-temporal data itself presents an interesting new challenge to data-conversion experts -- namely, it is often irregular. Figure 3 simulates how dissimilar each of three real-time events can be. All three points represent consumers subscribing to the same LBS provider, which captures and stores their event histories. |
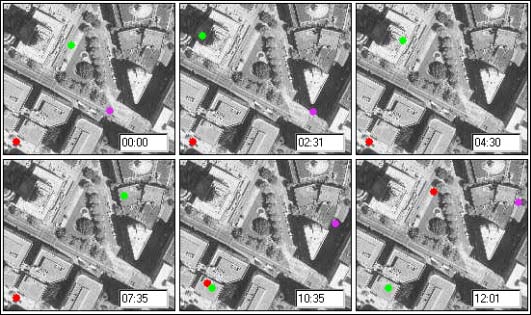 Figure 3a: This simulation of three people moving over time in downtown Oakland, California, is available online as a Java applet at www.giswebsite.com/java/PeetTrak/PeepTrak.htm. Its original intent was to identify contamination cluster points for biological or chemical terrorist attacks based on hospitalized patients’ recent location histories. |
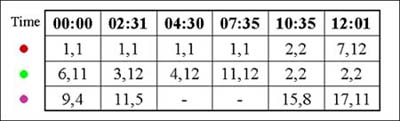 Figure 3b: Traditional GIS attributes store the irregular real-time data associated with Figure 3a inefficiently. |
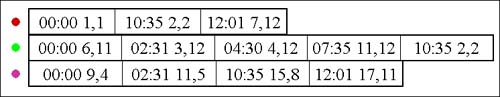 Figure 3c: IBM’s time-series solution handles irregular data in variable-length arrays for each moving point. |
|
Notice how the red object only changes position twice during the observation period, the
green object changes five times, and the purple object temporarily fails to transmit a
signal at all because of interference or battery drain. All three points make their moves
at irregular intervals, sometimes staying in one place for several hours, sometimes moving
twice within two hours. The height problem. Elevation also affects proximity -- are two people with the same x and y coordinates standing looking at each other, or are they each in their own corner offices on different floors of the same building, and not really in close proximity at all? What’s the best way to store these events so they can be overlaid with static basemap data in a GIS or imaging program? Irregular real-time data can be stored and manipulated in a variety of ways, but there isn’t yet a real-time storage standard in use by the spatial community. Mining time. Coincidentally, this kind of irregular behavior is similar to stock market ticker data for a portfolio of disparate stocks. Stock values change rapidly in real time, cease to be active on weekends and holidays, and may disappear entirely from an index if they fall below a limit. Stock market data miners use custom solutions to capture and then analyze regular and irregular time-based data. Such time-series database products can also be applied to spatial data, storing a variable-length array of locations and their offsets from a starting time for each moving point in a collection. This storage format and its builtin analysis functions reveal patterns over time, a function strangely absent from most LBS Web sites. Maybe data mining event histories raises privacy issues. But, rather than needing to watch events moving in real-time, won’t many users want to see event histories such as where the fleet’s vehicles were two hours ago, or the path of an important moving object over the past day, month, or year? Storing incoming real-time data over time enables users to ask such complex spatio-temporal questions as, "What was the average flow of people past my store between 10:00 AM and 12:00 PM over the past three months?" Using a time-series format within a database preserves the original irregular nature of real-time data (including nulls when signals drop out) but can streamline temporal analysis. For instance, users conducting spatiotemporal analysis of leisure travel patterns might define calendar templates that limit a year-long collection of real-time data to only holidays and weekends.
|
| 1. Introduction and Glossary 2. Data Flow 3. Indexing Challenge 4. Instant Messaging Conundrum |
|
|